Tracking the right franchise performance metrics for each operation will determine the business’s success. We’ve seen first-hand how data-driven decision-making can transform franchising.
This blog post will explore the key performance indicators every franchisor should monitor to drive growth and profitability.
We’ll cover financial, operational, and expansion metrics that provide a comprehensive view of franchise health.
Financial Metrics That Drive Franchise Success
Gross Revenue: The Foundation of Financial Performance
Gross revenue forms the foundation of any franchise operation’s financial performance and is an important franchise performance metric.
It represents the total amount of money your franchise generates before deductions. FranData’s report indicates that the average gross revenue for franchises across all industries reached $1.1 million in 2023 (although this figure varies widely by industry and franchise size).
ClientTether’s CRM system has helped franchises achieve up to 300% sales growth over 14 months.
That highlights the importance of not only tracking gross revenue but also implementing effective systems to boost it.
Net Profit Margin: Measuring True Profitability
Net profit margin reveals how much of your revenue translates into actual profit. The average net profit margin across all industries is 8.54%.
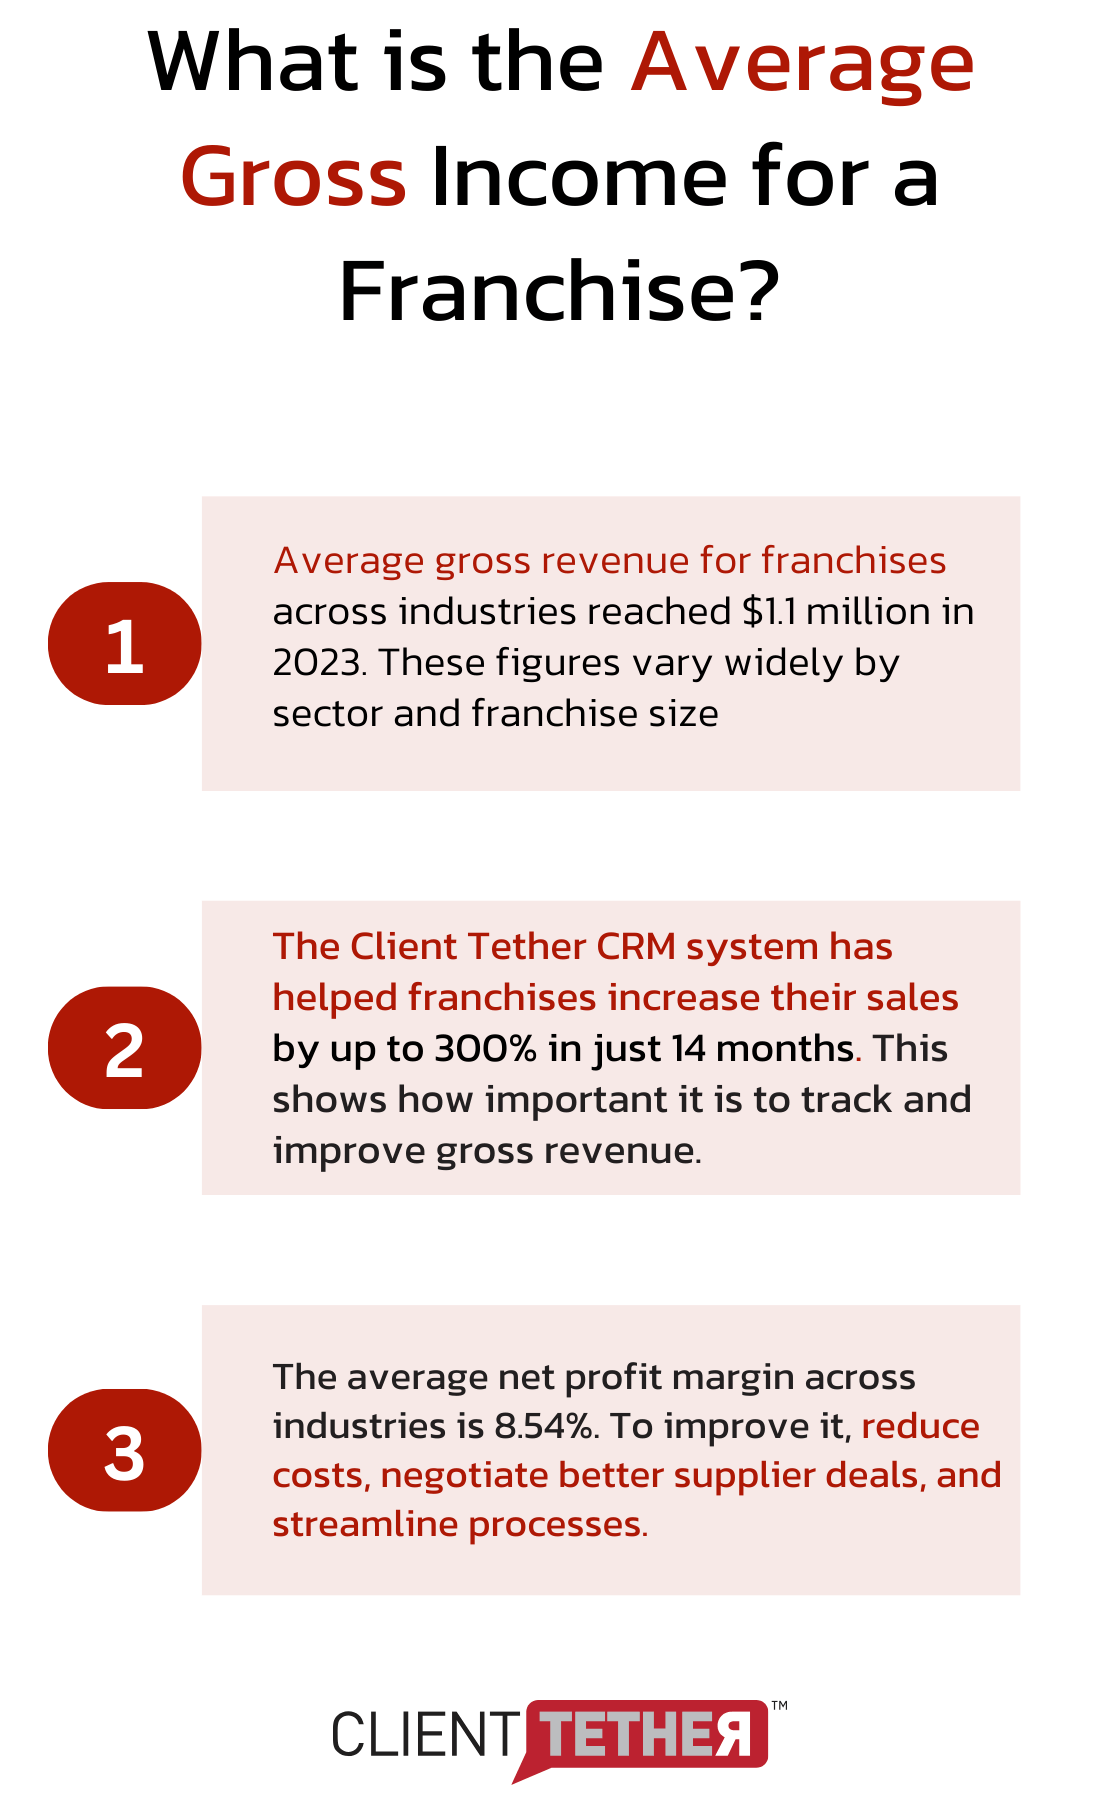
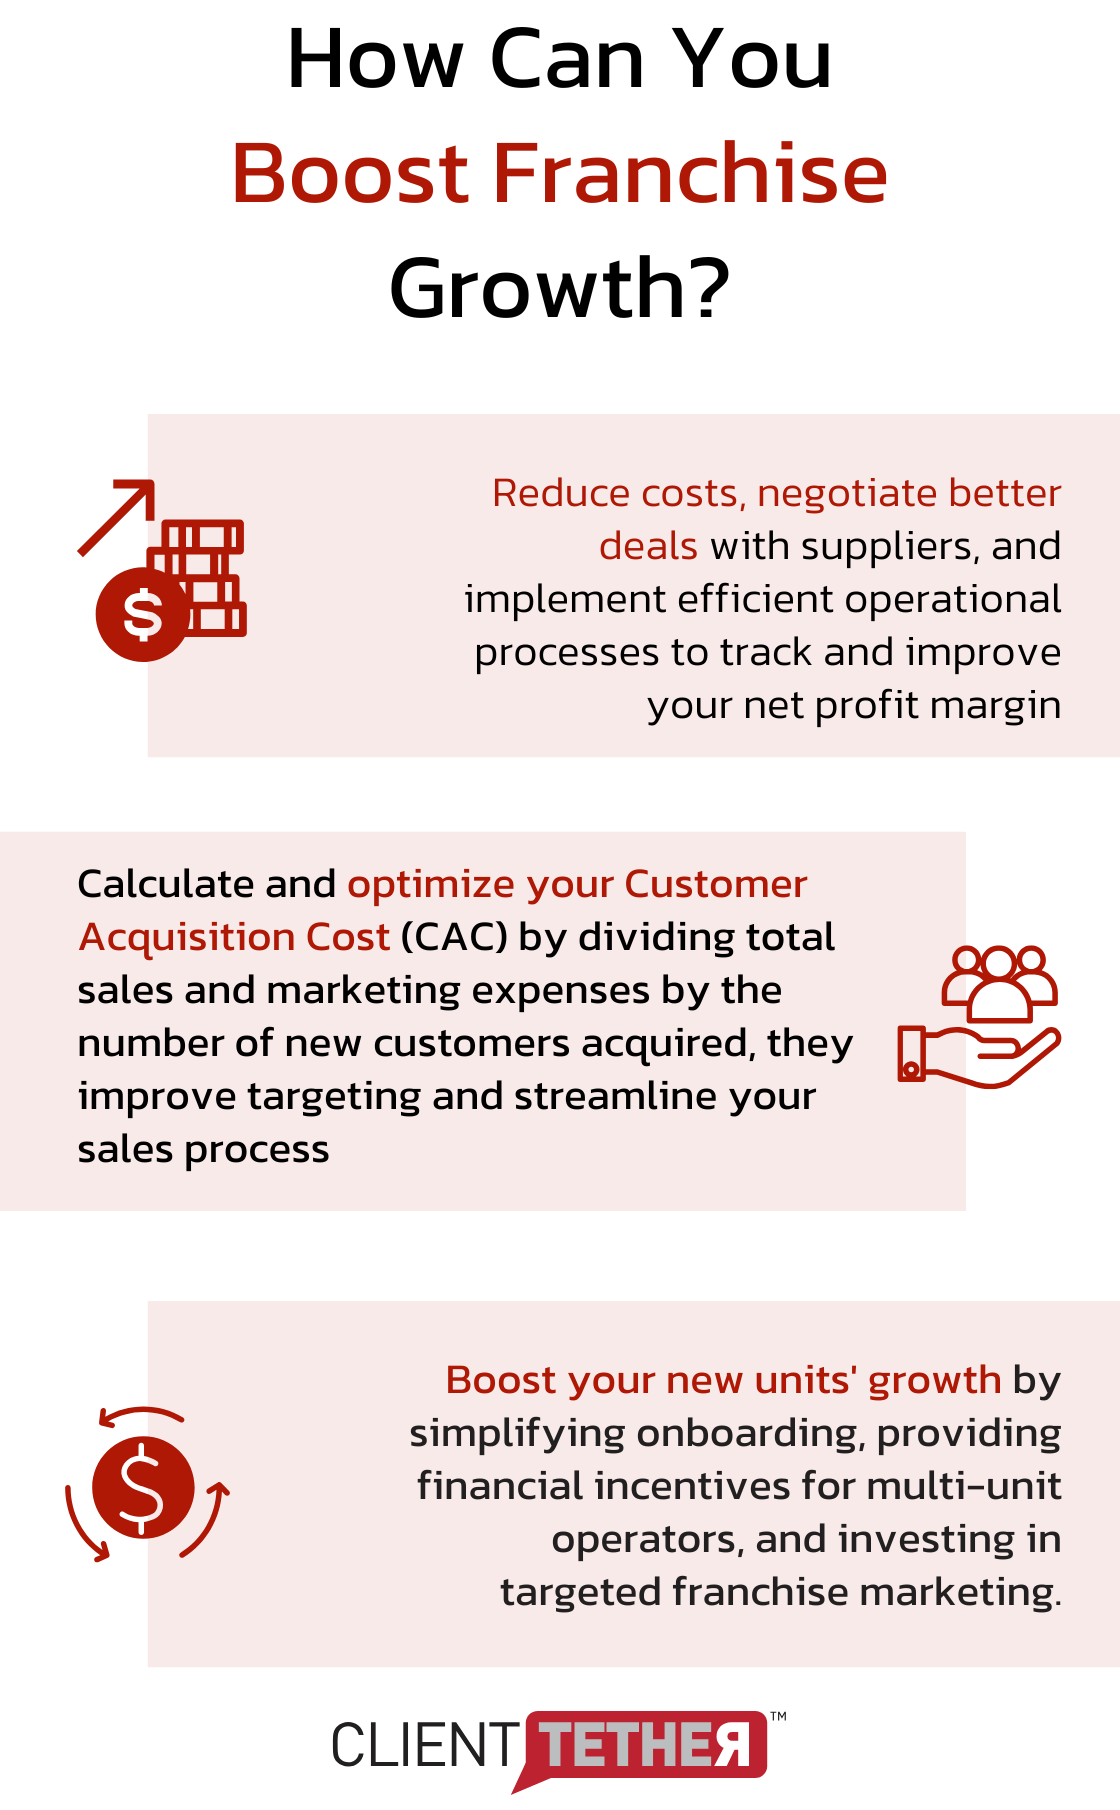
To improve your net profit margin:
- Reduce costs without compromising quality
- Negotiate better deals with suppliers
- Implement more efficient operational processes
Same-Store Sales Growth: Assessing Consistent Performance
Same-store sales growth compares the revenue of existing locations over different periods.
This metric eliminates the impact of new store openings, providing a clear picture of your franchise system’s health. A positive same-store sales growth indicates strong performance from existing franchisees and resonance of your brand with customers.
The growth of service-based businesses and QSRs is expected to outpace the rest of the franchising sector, which is still recovering from the pandemic.
Consistent growth in this metric often leads to higher franchisee satisfaction and easier recruitment of new franchisees. It serves as a key indicator of a solid franchise system foundation.
Cost of Goods Sold (COGS): Controlling Expenses
COGS represents the direct costs associated with producing your goods or services. It’s a critical metric for understanding and controlling your expenses.
The ideal COGS percentage varies by industry, but generally, try to keep it as low as possible without sacrificing quality.
To optimize your COGS:
- Streamline your supply chain
- Negotiate better prices with suppliers
- Reduce waste in production processes
Return on Investment (ROI): Measuring Profitability
ROI measures the profitability of your franchise investments. Calculate it by dividing net profit by total investment and multiplying by 100.
A higher ROI indicates more efficient use of capital and better overall financial health.
To improve ROI:
- Increase revenue through effective marketing and sales strategies
- Reduce costs without compromising quality
- Optimize operational efficiency.
These financial metrics provide a comprehensive view of your franchise’s financial health. Use this data to make informed decisions, optimize operations, and drive sustainable growth.
In the next section, we’ll explore operational efficiency metrics that complement these financial indicators and provide a more holistic view of your franchise’s performance.
Boosting Operational Efficiency: Key Franchise Performance Metrics for Success
Customer Acquisition Cost (CAC)
Customer Acquisition Cost (CAC) is a crucial metric for businesses, especially B2B startups with both inbound and outbound channels. It measures the total cost of acquiring a new customer.
To calculate CAC, divide your total sales and marketing expenses by the number of new customers acquired in a given period. A lower CAC indicates more efficient marketing and sales processes.
Tips to reduce your CAC:
- Optimize your marketing channels.
- Improve your targeting to reach high-quality leads
- Streamline your sales process.
Customer Lifetime Value (CLV)
CLV represents the total revenue a business can expect from a single customer account. Bain & Company reports that a 5% increase in customer retention rates can boost profits by 25% to 95%.
Calculate CLV by multiplying the average purchase value by the average purchase frequency rate and the average customer lifespan.
Strategies to increase CLV:
- Implement loyalty programs
- Provide exceptional customer service
- Offer personalized experiences
Employee Turnover Rate
Employee turnover is an important factor that influences job satisfaction and dissatisfaction.
Understanding the factors that promote employee job satisfaction can help managers reduce turnover rates.
Calculate your turnover rate: divide the number of employees who left during a period by the average number of employees and multiply by 100.
To reduce employee turnover:
- Offer competitive compensation and benefits
- Provide clear career advancement opportunities
- Foster a positive work culture
Inventory Turnover Ratio
This metric measures how quickly you sell and replace inventory. A higher ratio generally indicates better sales performance and inventory management.
Calculate your inventory turnover ratio by dividing the cost of goods sold by the average inventory for a given period.
The ideal ratio varies by industry, but generally, a higher ratio is better.
To improve your inventory turnover ratio:
- Use data analytics to forecast demand accurately
- Implement just-in-time inventory management
- Optimize your supply chain
Average Transaction Value
Increasing your average transaction value can significantly boost your revenue without necessarily increasing your customer count.
Calculate this metric by dividing your total revenue by the number of transactions in a given period.
Strategies to increase average transaction value:
- Implement effective upselling and cross-selling techniques
- Offer bundled products or services
- Provide tiered pricing options
These operational efficiency metrics help franchisors identify areas for improvement and implement strategies to boost overall performance.
The next chapter will explore franchise growth and expansion metrics, which complement these operational indicators to provide a comprehensive view of your franchise’s health and potential for growth.
Franchise Growth Metrics That Drive Expansion
New Unit Growth Rate
The rate at which new franchise units open indicates system health and attractiveness. This varies across industries, with personal services and quick-service restaurants leading.
To boost your new unit growth rate:
- Streamline your franchise onboarding process
- Offer attractive financial incentives for multi-unit operators
- Invest in targeted franchise development marketing campaigns
Unit Closure Rate and Net Unit Growth
Track your franchise closure rate as closely as your openings. High closure rates can undermine growth and signal problems.
Ensure positive net growth (new units minus closed units) for sustainable expansion.
To reduce unit closures:
- Implement rigorous franchisee selection processes
- Provide ongoing support and training to struggling units
- Regularly assess unit profitability and address issues proactively
Territory Penetration and Market Saturation
Understanding your brand’s territory penetration helps identify growth opportunities and avoid market saturation.
Calculate this metric by dividing the number of existing units in a territory by the total potential units the area can support.
To optimize territory penetration:
- Conduct thorough market research to identify high-potential areas
- Develop a strategic expansion plan that balances growth with market demand
- Consider alternative unit formats (e.g., kiosks, mobile units) to penetrate challenging markets
Franchise Lead Conversion Rate
The franchise lead conversion rate measures the effectiveness of your franchise development efforts. It represents the percentage of leads that convert into actual franchisees. A higher conversion rate indicates more efficient marketing and sales processes.
To improve your franchise lead conversion rate:
- Refine your ideal franchisee profile
- Create targeted marketing campaigns
- Implement a robust lead capture and nurturing process
Time to Break Even for New Units
The time it takes for new franchise units to reach profitability is a critical metric for both franchisors and franchisees.
A shorter break-even period indicates a more attractive franchise opportunity and can lead to faster system-wide growth.
To reduce the time to break even:
- Provide comprehensive training and support during the launch phase
- Help franchisees optimize their local marketing efforts
- Continuously refine your business model to improve unit economics
These growth metrics enable franchisors to make data-driven decisions for effective network expansion.
Sustainable growth requires more than just opening new units – it demands building a resilient system that supports long-term success for both the franchisor and franchisees.
Your Takeaways on Franchise Performance Metrics
Tracking franchise performance metrics is essential for the success and growth of your franchise system. Monitoring financial, growth and operational metrics provides invaluable insights into your business’s health and potential areas for improvement.
You don’t need a complicated system to start tracking KPIs; identify the most critical metrics for your franchise and establish a regular reporting schedule.
ClientTether’s franchise management CRM offers powerful tools for tracking and visualizing key performance indicators. These tools help franchisors make data-driven decisions with ease.
The true power of KPIs lies in how you use them to drive action, not in the numbers themselves.
Regularly review your franchise performance metrics, identify trends, and develop strategies to address issues or capitalize on opportunities. Share relevant data with your franchisees to foster transparency and alignment across your network.
Those who harness the power of data will be best positioned to thrive in the ever-evolving franchise world.